Operations on masks
Given a Spectrum, Image or Cube object, O, the pixel values and variances of this object can be accessed via the O.data and O.var arrays. These are masked arrays, which are arrays that can have missing or invalid entries. Masked arrays, which are provided by the numpy.ma module, provide a nearly work-alike replacement for numpy arrays. The O.data and O.var arrays share a single array of boolean masking elements. This is a simple boolean array, and it can be accessed directly via the O.mask property. The elements of this array can be modified implicitly or explicitly via operations on the data, variance or mask arrays. For example:
In [1]: import numpy as np
In [2]: import matplotlib.pyplot as plt
In [3]: from mpdaf.obj import Image
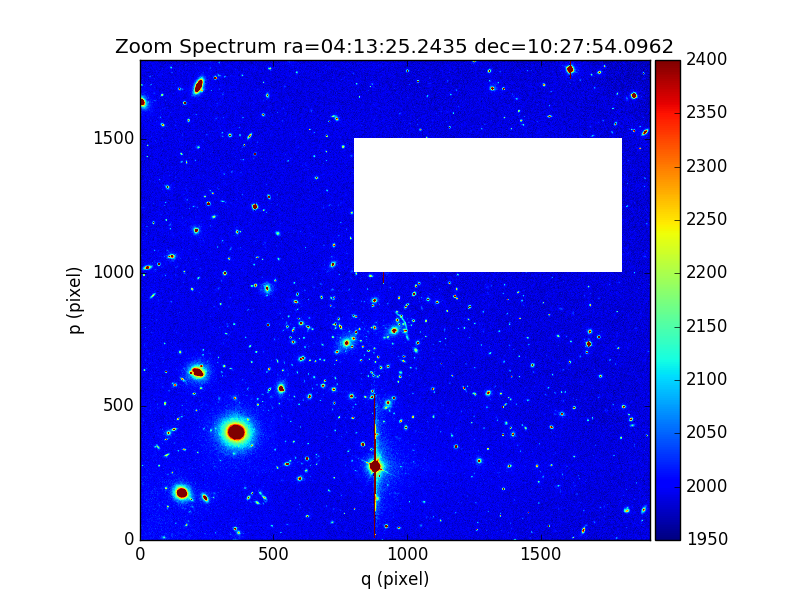
In [4]: ima = Image('../data/obj/a370II.fits')
In [5]: ima.data[1000:1500, 800:1800] = np.ma.masked
# is equivalent to
In [6]: ima.mask[1000:1500, 800:1800] = True
In [7]: ima.plot(vmin=1950, vmax=2400, colorbar='v')
Out[7]: <matplotlib.image.AxesImage at 0x7fb7356f8b50>
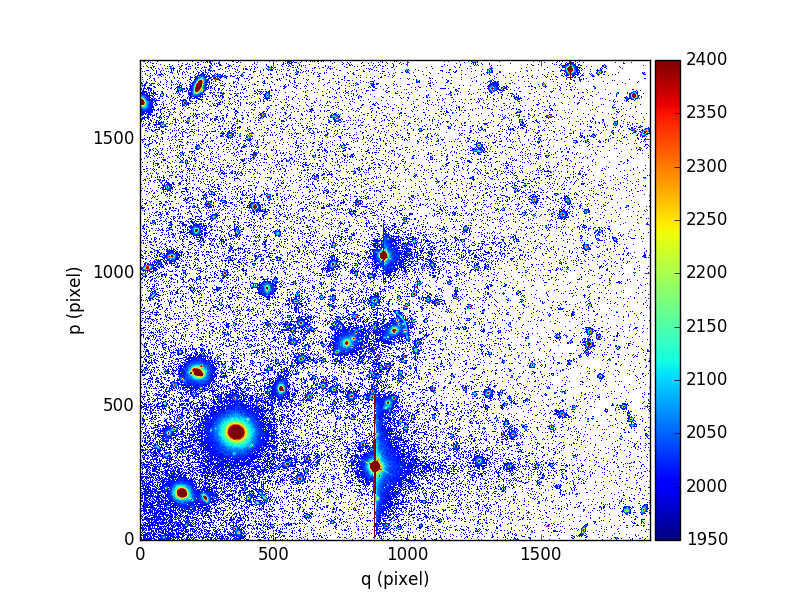
The comparison operators can also be used to mask all data that are not less
than or equal (<=) to a value, are not less than
(<) a value, are not greater than or equal (>=) to a value, or that are not greater than (>) a given value. In the following example, the
< operator is used to select data that have values over 2000, and mask
everything below this threshold. In the plot of the resulting image, the masked
values below 2000 are drawn in white. These values would otherwise be dark blue
if they weren’t masked.
In [8]: ima.unmask()

In [9]: ima2 = ima > 2000

In [10]: plt.figure()
Out[10]: <matplotlib.figure.Figure at 0x7fb7356f8a50>

In [11]: ima2.plot(vmin=1950, vmax=2400, colorbar='v')
Out[11]: <matplotlib.image.AxesImage at 0x7fb735d3f590>
Note the use of the unmask method to clear the
current mask.
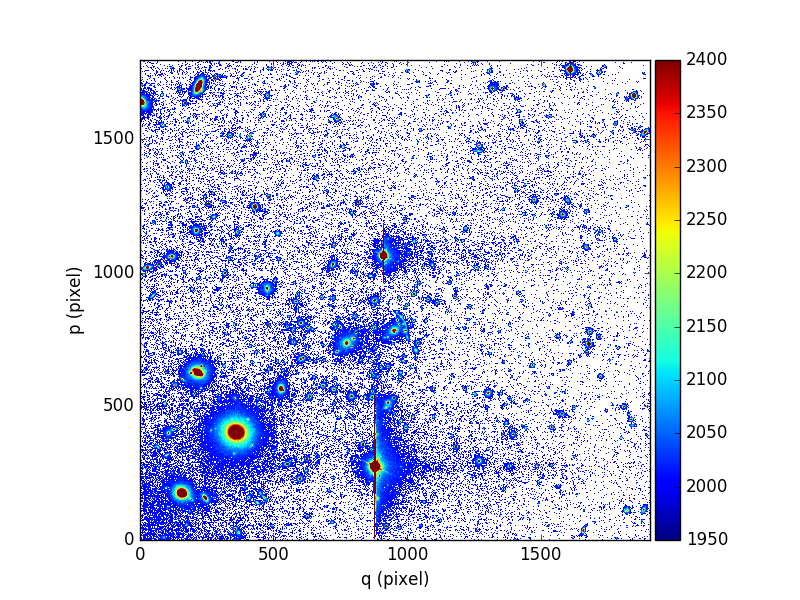
It is also possible to mask pixels that correspond to a selection, by using the
mask_selection method, or to mask pixels
whose variance exceeds a given threshold value, by using the mask_variance method:
In [12]: ima.unmask()

In [13]: ksel = np.where(ima.data < 2000)

In [14]: ima.mask_selection(ksel)

In [15]: plt.figure()
Out[15]: <matplotlib.figure.Figure at 0x7fb737ef7750>

In [16]: ima.plot(vmin=1950, vmax=2400, colorbar='v')
Out[16]: <matplotlib.image.AxesImage at 0x7fb737ca9590>
On Image or Cube objects, there are additional methods to mask inside or outside:
- a circular or rectangular region (
Image.mask_regionandCube.mask_region)- an elliptical region (
Image.mask_ellipseandCube.mask_ellipse)- a polygonal region (
Image.mask_polygonandCube.mask_polygon)
For example:
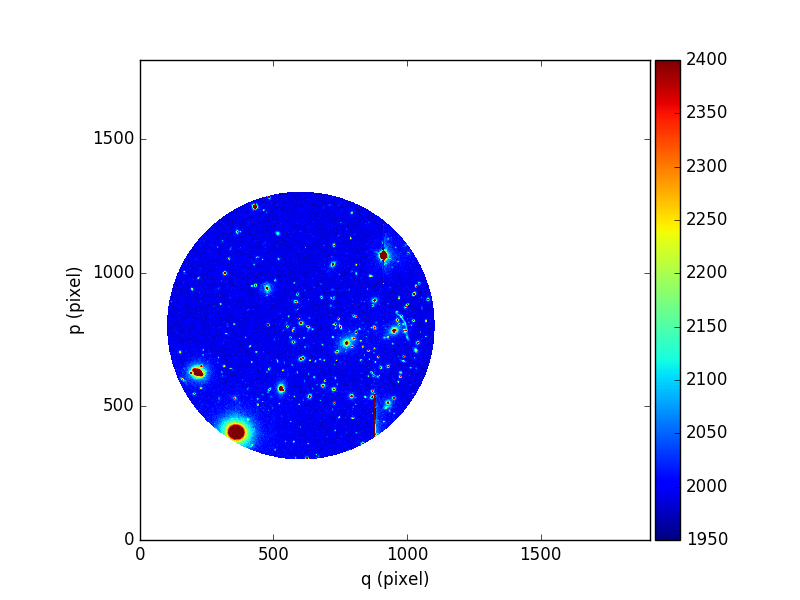
In [17]: ima.unmask()

In [18]: ima.mask_region(center=[800.,600.], radius=500., unit_center=None, unit_radius=None, inside=False)

In [19]: plt.figure()
Out[19]: <matplotlib.figure.Figure at 0x7fb74431b850>

In [20]: ima.plot(vmin=1950, vmax=2400, colorbar='v')
Out[20]: <matplotlib.image.AxesImage at 0x7fb737d0ae50>