Rearranging
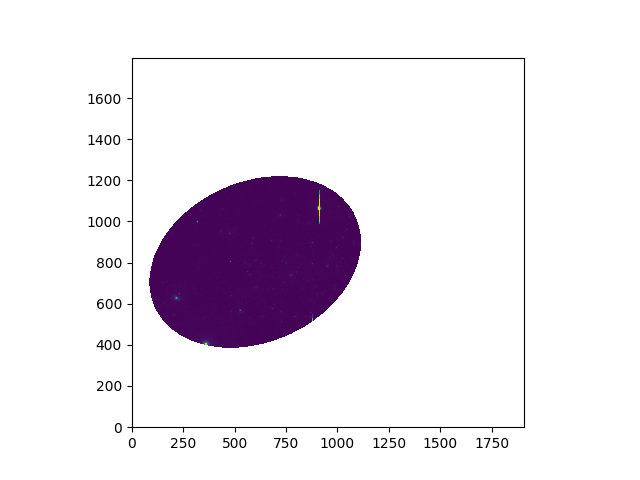
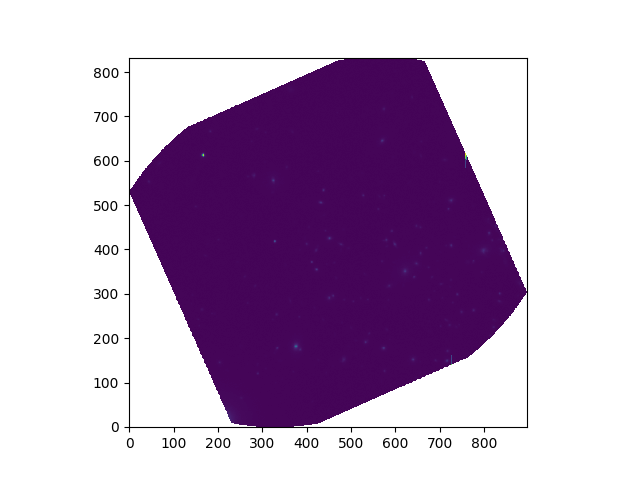
The crop method can be used to reduce the size of a
Cube, Image or Spectrum to the smallest sub-array that retains all unmasked
pixels. In the following example, the pixels outside of an elliptical region of
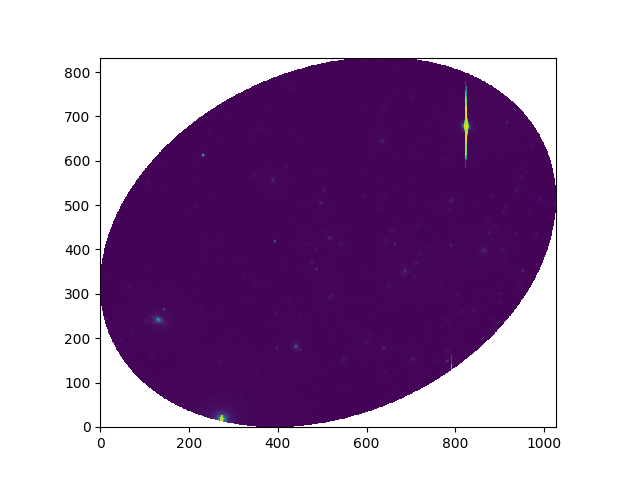
an image are first masked, and then the crop method is used to select the
sub-image that just contains the unmasked elliptical region:
In [1]: import numpy as np

In [2]: import matplotlib.pyplot as plt

In [3]: from mpdaf.obj import Image

In [4]: ima = Image('obj/a370II.fits')

In [5]: center=[-1.5642, 39.9620]

In [6]: ima.mask_ellipse(center=center, radius=(80, 110), posangle=ima.get_rot(), inside=False)

In [7]: ima.shape
Out[7]: (1797, 1909)

In [8]: plt.figure()
Out[8]: <Figure size 640x480 with 0 Axes>

In [9]: ima.plot()
Out[9]: <matplotlib.image.AxesImage at 0x7f50d918ba90>

In [10]: ima.crop()
Out[10]: (slice(385, 1218, None), slice(85, 1112, None))

In [11]: ima.shape
Out[11]: (833, 1027)

In [12]: plt.figure()
Out[12]: <Figure size 640x480 with 0 Axes>

In [13]: ima.plot()
Out[13]: <matplotlib.image.AxesImage at 0x7f50d9d4a7b8>
The Spectrum.truncate, Image.truncate and Cube.truncate
methods return a sub-object that is bounded by specified wavelength or/and
spatial world-coordinates:
In the following example, the image from the previous example is truncated to just enclose a region of the sky whose width in right ascension is 150 arc-seconds, and whose height in declination is also 150 arc-seconds. Since the ellipse of the previous example was deliberately aligned with the declination and right ascension axes, this effectively truncates the axes of the ellipse.
In [14]: ymin, xmin = np.array(center) - 75./3600

In [15]: ymax, xmax = np.array(center) + 75./3600

In [16]: ima2 = ima.truncate(ymin, ymax, xmin, xmax)

In [17]: plt.figure()
Out[17]: <Figure size 640x480 with 0 Axes>

In [18]: ima2.plot()
Out[18]: <matplotlib.image.AxesImage at 0x7f50d17dd2b0>

In [19]: ima2.get_rot()
Out[19]: 113.8261800053088
The ranges x_min to x_max and y_min to y_max, specify a rectangular region of the sky in world coordinates. The truncate function returns the sub-image that just encloses this region. In the above example, the world coordinate axes are not parallel to the array axes, so there are some pixels in the image that are outside the specified world-coordinate region. These pixels are masked.
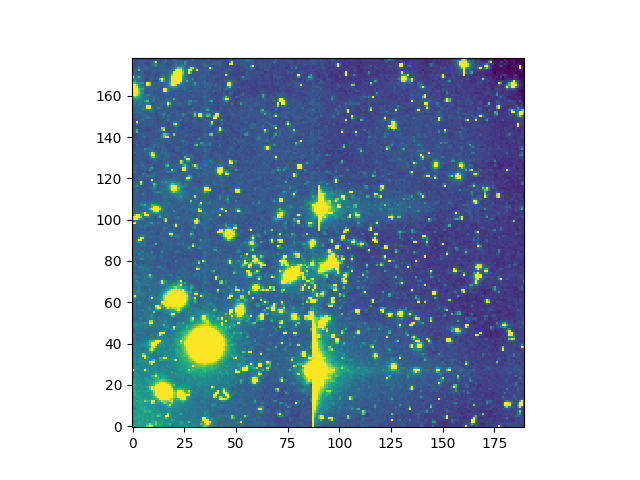
The methods Spectrum.rebin, Image.rebin and Cube.rebin reduce the
array dimensions of these objects by integer factors, without changing the area
of sky that they cover. They do this by creating a new object whose pixels are
the mean of several neighboring pixels of the input object.
In [20]: ima = Image('obj/a370II.fits')

In [21]: ima.info()
[INFO] 1797 x 1909 Image (obj/a370II.fits)
[INFO] .data(1797 x 1909) (no unit), no noise
[INFO] center:(-01:35:06.1921,02:39:51.6357) size:(369.366",392.816") step:(0.206",0.206") rot:113.8 deg frame:FK5

In [22]: plt.figure()
Out[22]: <Figure size 640x480 with 0 Axes>

In [23]: ima.plot(zscale=True)
Out[23]: <matplotlib.image.AxesImage at 0x7f50d1b49668>

In [24]: ima2 = ima.rebin(factor=10)

In [25]: ima2.info()
[INFO] 179 x 190 Image (obj/a370II.fits)
[INFO] .data(179 x 190) (no unit), no noise
[INFO] center:(-01:35:06.0563,02:39:51.6392) size:(367.927",390.964") step:(2.055",2.058") rot:113.8 deg frame:FK5

In [26]: plt.figure()
Out[26]: <Figure size 640x480 with 0 Axes>

In [27]: ima2.plot(zscale=True)
Out[27]: <matplotlib.image.AxesImage at 0x7f50d9a69358>

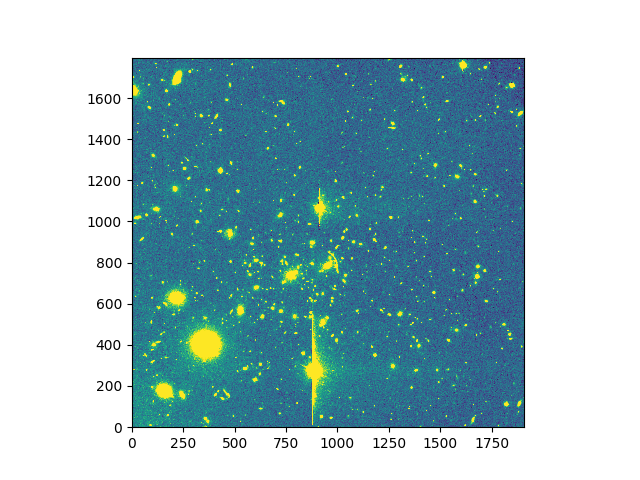
The methods Spectrum.resample and
Image.resample resample a spectrum or image to a
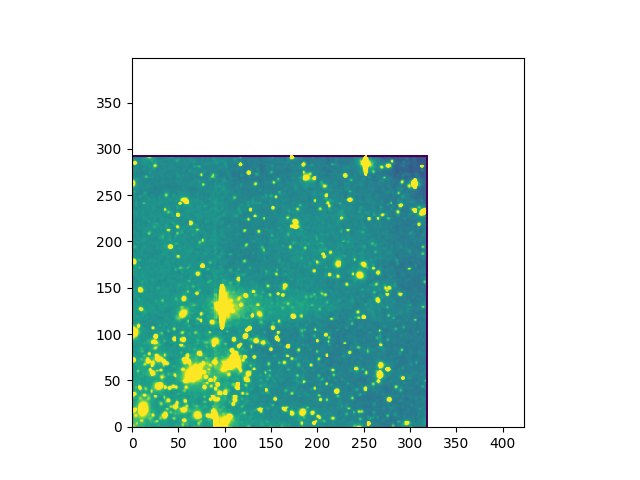
new world-coordinate grid. The following example resamples an image to change
its angular resolution and also to change which sky position appears at the
center of pixel [0,0]:
In [28]: ima = Image('obj/a370II.fits')

In [29]: ima.info()
[INFO] 1797 x 1909 Image (obj/a370II.fits)
[INFO] .data(1797 x 1909) (no unit), no noise
[INFO] center:(-01:35:06.1921,02:39:51.6357) size:(369.366",392.816") step:(0.206",0.206") rot:113.8 deg frame:FK5

In [30]: plt.figure()
Out[30]: <Figure size 640x480 with 0 Axes>

In [31]: ima.plot(zscale=True)
Out[31]: <matplotlib.image.AxesImage at 0x7f50da932ac8>

In [32]: newdim = (np.array(ima.shape)/4.5).astype(int)

In [33]: import astropy.units as u

In [34]: newstep = ima.get_step(unit=u.arcsec) * 4.5

In [35]: newstart =  np.array(center) + 50./3600

In [36]: ima2 = ima.resample(newdim, newstart, newstep)

In [37]: ima2.info()
[INFO] 399 x 424 Image (no name)
[INFO] .data(399 x 424) (no unit), no noise
[INFO] center:(-01:37:14.9682,02:39:48.2648) size:(369.058",392.610") step:(0.925",0.926") rot:113.8 deg frame:FK5

In [38]: plt.figure()
Out[38]: <Figure size 640x480 with 0 Axes>

In [39]: ima2.plot(zscale=True)
Out[39]: <matplotlib.image.AxesImage at 0x7f50db0fba20>