Getting Started
Importing MPDAF
MPDAF is divided into sub-packages, each of which is composed of several
classes. The following example shows how to import the Cube and
PixTable classes:
In [1]: from mpdaf.obj import Cube

In [2]: from mpdaf.drs import PixTable
All of the examples in the MPDAF web pages are shown being typed into
an interactive IPython shell. This shell is the origin of the prompts
like In [1]: in the above example. The examples can also be entered
in other shells, such as the native Python shell.
Loading your first MUSE datacube
MUSE datacubes are generally loaded from FITS files. In these files the fluxes and variances are stored in separate FITS extensions. For example:
# data and variance arrays are read from DATA and STAT extensions of the file
In [3]: cube = Cube('obj/CUBE.fits')
---------------------------------------------------------------------------
OSError                                   Traceback (most recent call last)
Cell In[3], line 1
----> 1 cube = Cube('obj/CUBE.fits')

File ~/checkouts/readthedocs.org/user_builds/mpdaf/envs/latest/lib/python3.13/site-packages/mpdaf/obj/data.py:290, in DataArray.__init__(self, filename, hdulist, data, mask, var, ext, unit, copy, dtype, primary_header, data_header, convert_float64, **kwargs)
    287 if (filename is not None or hdulist is not None) and data is None:
    288     # Read the data from a FITS file
    289     if not hdulist and not is_valid_fits_file(filename):
--> 290         raise OSError('Invalid file: %s' % filename)
    292     if hdulist is None:
    293         fits_kwargs = kwargs.pop('fits_kwargs', {})

OSError: Invalid file: obj/CUBE.fits

In [4]: cube.info()
---------------------------------------------------------------------------
NameError                                 Traceback (most recent call last)
Cell In[4], line 1
----> 1 cube.info()

NameError: name 'cube' is not defined
The listed dimensions of the cube, 1595 x 10 x 20, indicate that the cube has 1595 spectral pixels and 10 x 20 spatial pixels. The order in which these dimensions are listed, follows the indexing conventions used by Python to handle 3D arrays (see Spectrum, Image and Cube format for more information).
Let’s compute the reconstructed white-light image and display it. The white-light image is obtained by summing each spatial pixel of the cube along the wavelength axis. This converts the 3D cube into a 2D image.
In [5]: ima = cube.sum(axis=0)
---------------------------------------------------------------------------
NameError                                 Traceback (most recent call last)
Cell In[5], line 1
----> 1 ima = cube.sum(axis=0)

NameError: name 'cube' is not defined

In [6]: type(ima)
---------------------------------------------------------------------------
NameError                                 Traceback (most recent call last)
Cell In[6], line 1
----> 1 type(ima)

NameError: name 'ima' is not defined

In [7]: plt.figure()
Out[7]: <Figure size 640x480 with 0 Axes>

In [8]: ima.plot(scale='arcsinh', colorbar='v')
---------------------------------------------------------------------------
NameError                                 Traceback (most recent call last)
Cell In[8], line 1
----> 1 ima.plot(scale='arcsinh', colorbar='v')

NameError: name 'ima' is not defined
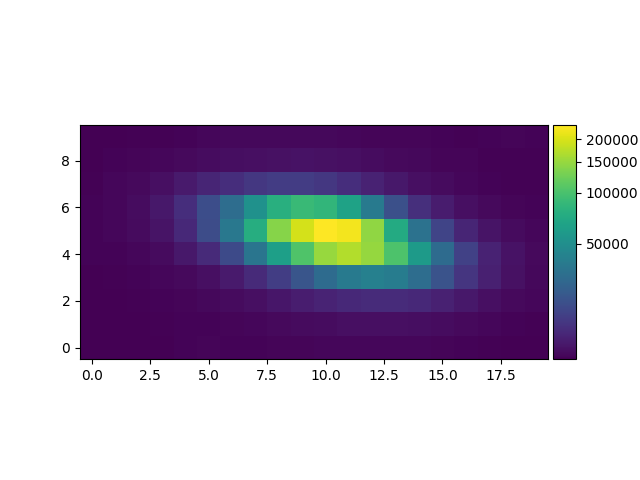
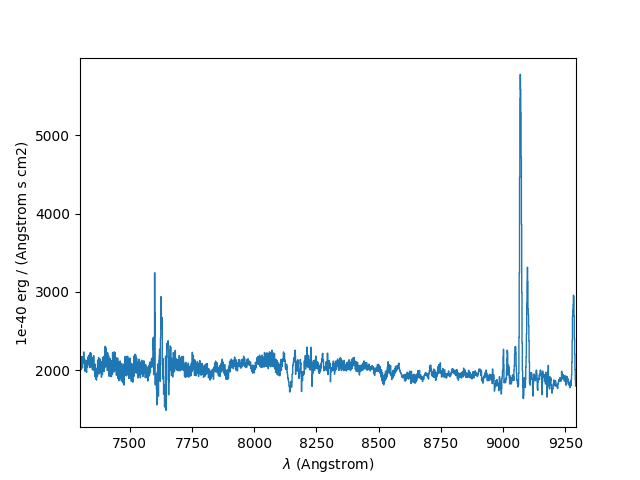
Let’s now compute the overall spectrum of the cube by taking the cube and summing along the X and Y axes of the image plane. This yields the total flux per spectral pixel.
In [9]: sp = cube.sum(axis=(1,2))
---------------------------------------------------------------------------
NameError                                 Traceback (most recent call last)
Cell In[9], line 1
----> 1 sp = cube.sum(axis=(1,2))

NameError: name 'cube' is not defined

In [10]: type(sp)
---------------------------------------------------------------------------
NameError                                 Traceback (most recent call last)
Cell In[10], line 1
----> 1 type(sp)

NameError: name 'sp' is not defined

In [11]: plt.figure()
Out[11]: <Figure size 640x480 with 0 Axes>

In [12]: sp.plot()
---------------------------------------------------------------------------
NameError                                 Traceback (most recent call last)
Cell In[12], line 1
----> 1 sp.plot()

NameError: name 'sp' is not defined
Logging
When imported, MPDAF initialize a logger by default. This logger uses the
logging module, and log messages to stderr, for instance for the .info()
methods. See Logging (mpdaf.log) for more details.
Online Help
Because different sub-packages have very different functionality,
further suggestions for getting started are provided in the online
documentation of these sub-packages. For example, click on Cube object,
Image object, or Spectrum object for help with the 3 main classes of
the mpdaf.obj package.
Alternatively, if you use the IPython interactive python shell, then you can
look at the docstrings of classes, objects and functions by following them with
the magic ? of IPython. Examples of this are shown below. A more general
way to see these docstrings, which works in all Python shells, is to use the
built-in help() function:
In [13]: Cube.median?
Signature: Cube.median(self, axis=None)
Docstring:
Return the median over a given axis.

Beware that if the pixels of the cube have associated variances, these
are discarded by this function, because there is no way to estimate the
effects of a median on the variance.

Parameters
----------
axis : int or tuple of int, optional
    The axis or axes along which a median is performed.

    The default (axis = None) performs a median over all the
    dimensions of the cube and returns a float.

    axis = 0 performs a median over the wavelength dimension and
    returns an image.

    axis = (1,2) performs a median over the (X,Y) axes and
    returns a spectrum.
File:      ~/checkouts/readthedocs.org/user_builds/mpdaf/envs/latest/lib/python3.13/site-packages/mpdaf/obj/cube.py
Type:      function
In [14]: help(ima.plot)
---------------------------------------------------------------------------
NameError                                 Traceback (most recent call last)
Cell In[14], line 1
----> 1 help(ima.plot)

NameError: name 'ima' is not defined